en


Other tools
Excel and Power BI developed by Microsoft are widely used tools for data management, analysis, and visualization.
Here is a brief introduction to each of them:
Proxima has supported many companies in optimizing and best practices for using these tools.
Microsoft Excel:
In our initial phases of project conceptualization and schematization, we often use Microsoft Excel. This tool, known for its flexibility and ease of use, allows us to quickly compile our collective ideas and structure the initial project data. We use Excel to create detailed drafts that facilitate communication and encourage collaboration within the team. Additionally, it serves as an easy gateway to more specialized software, ensuring a smooth and efficient project start.
In brief, Microsoft Excel is a powerful spreadsheet that allows you to create, organize, and manipulate worksheets containing data in rows and columns. It offers numerous features for performing calculations, data analysis, and creating charts.
Common Uses:
- Creating calendars and schedules: Tracking project deadlines and milestones.
- Task management: Monitoring tasks, assigning them to team members, and tracking their progress.
- Budgeting: Managing project budgets by tracking expenses and financial forecasts.
- Data analysis: Using charts and pivot tables to analyze project data.
- Resource tracking: Managing the human and material resources needed for the project.
- Reporting: Creating detailed reports to communicate project progress to stakeholders.
- Automation: Using macros and formulas to automate repetitive tasks.
Advantages:
- Can be used for a variety of project management tasks.
- Widely available and often already installed on computers.
- Allows for creating custom solutions tailored to specific project needs.
- Robust data analysis tools, including charts and pivot tables.
- Ability to automate repetitive tasks with macros and formulas.
Limitations:
- Can become complex to use for large-scale projects.
- Less effective for real-time collaboration compared to specialized tools.
- Data entry errors can have significant consequences.
- Some advanced project management features may be lacking.
- Can slow down with large files or complex calculations.
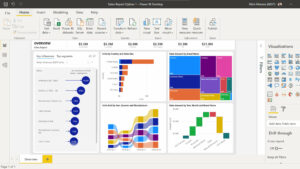
Power BI (Business Intelligence):
At Proxima, innovation never stops when it comes to finding the most effective ways to visualize and share information. Although PowerPoint was our main ally for creating static presentations in the past, today we prefer Microsoft Power BI, a significant evolution in data representation and sharing.
Thanks to the power of the cloud, we integrate data from various sources with Power BI, creating dynamic and interactive visualizations that bring our projects to life. Not only does this tool excel compared to PowerPoint by offering real-time insights and customizable dashboards, but it also facilitates the secure sharing of dashboard visualization links within our team. This encourages closer collaboration and a deeper understanding of project nuances.
Power BI also offers seamless integration with other Microsoft tools, including PowerPoint, allowing for a smooth fusion of platform functionalities as needed. By adopting Power BI, we do not limit ourselves to data presentation; we pave the way for an immersive experience, providing precise insights and powerful analyses that guide our team towards informed decisions based on reliable and current information.”
“In brief, Power BI is a suite of data analysis and visualization tools that allows users to create interactive reports and dynamic dashboards. It connects to various data sources and offers advanced modeling and analysis features. Users can make the most of their data, from initial collection to advanced analysis and visual presentation.
Common Uses:
- Dashboard creation: Visualizing project data in real-time to track performance and key indicators.
- Interactive reports: Generating detailed and interactive reports to analyze project data.
- Data analysis: Using Power BI to explore and analyze project data from various sources.
- Data consolidation: Integrating data from multiple sources.
- Resource tracking: Managing and tracking the human and material resources needed for the project.
- Forecasting and trends: Analyzing trends and forecasts.
- Collaboration: Sharing dashboards and reports among stakeholders.
Advantages:
- Allows for the creation of interactive and attractive visualizations.
- Ability to integrate data from multiple sources.
- Real-time access to data and reports from any device.
- Intuitive and easy-to-use user interface.
- Easy sharing of reports and dashboards with team members.
Limitations:
- May require a learning curve to fully leverage its advanced features. Proxima is here to help!
- The full version of Power BI requires a license.
Have you considered integrating these tools with Teams?